
Happy National Tartan Day
Author: Bill Caudill, Director of the Scottish Heritage Center National Tartan Day, observed in the United States on April 6 every year, commemorates the day


A degree in business can take you almost anywhere. The skills learned and knowledge gained from this line of study can be applied to multiple careers as well as graduate programs.

The teacher education major at St. Andrews University is designed and presented by expert educators who continue to be connected to public education, sharing a world of resources and opportunities to help you learn and grow.

This line of study equips our students with the skills and knowledge needed to succeed in many equine related careers from barn owner/manager, professional rider/trainer, veterinary school, therapeutic horsemanship, horse show management, or instructor.

The healthcare industry is ever-growing, creating a wealth of job opportunities for potential applicants. Get in on this exciting industry with a degree from St. Andrews University.

The Division of Liberal & Creative Arts (DLCA) at St. Andrews University provides our students with 11 academic majors, 16 university programs, and countless opportunities to express their creative side.

A degree in science can lead you to many exciting careers. It’s up to you to choose your path. Perhaps you want to work in a pharmaceutical lab or process crime scene evidence. Maybe you want to start the journey toward medical or veterinary school.

St. Andrews University brings students a diverse catalog of courses and majors. If being active and having variety in your daily life is important to you, you may consider one of our many programs in our sports studies department.
Author: Bill Caudill, Director of the Scottish Heritage Center National Tartan Day, observed in the United States on April 6 every year, commemorates the day

We are launching a $5 million capital campaign and I am asking you to join us – UKnighted for St. Andrews!

Dorothy Miller, PhD, MPH, MSN, RN, CNE Department Chair, Health Sciences Growing up, I knew I wanted to become a nurse. I imagined myself working
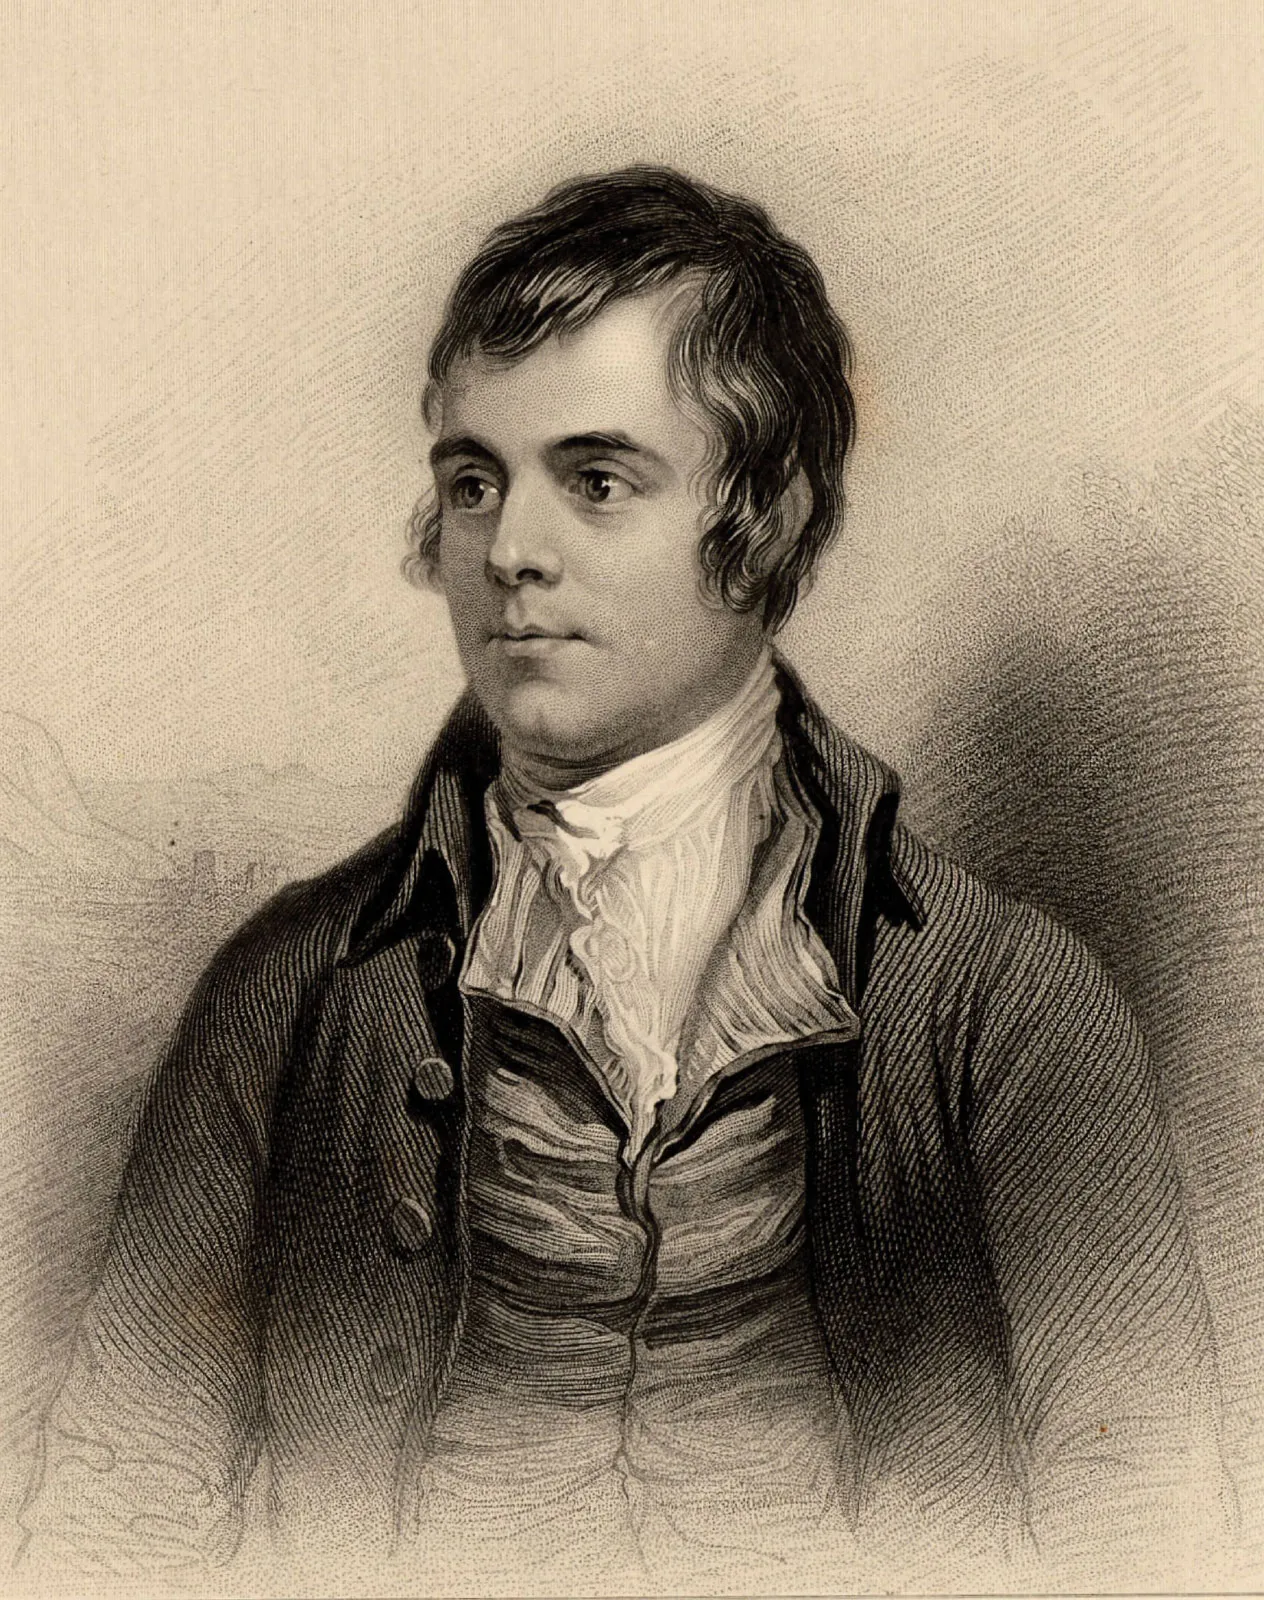
Author: Bill Caudill, Director of the Scottish Heritage Center Today, January 25 is the birthday of Scottish poet Robert Burns. There will be celebrations today